


To simplify the management and analysis of related data, you can convert a range of cells into an Excel table (previously known as an Excel list).
Or to know more about simplifying data analysis, you can check out this blog.
So, what is an Excel table?
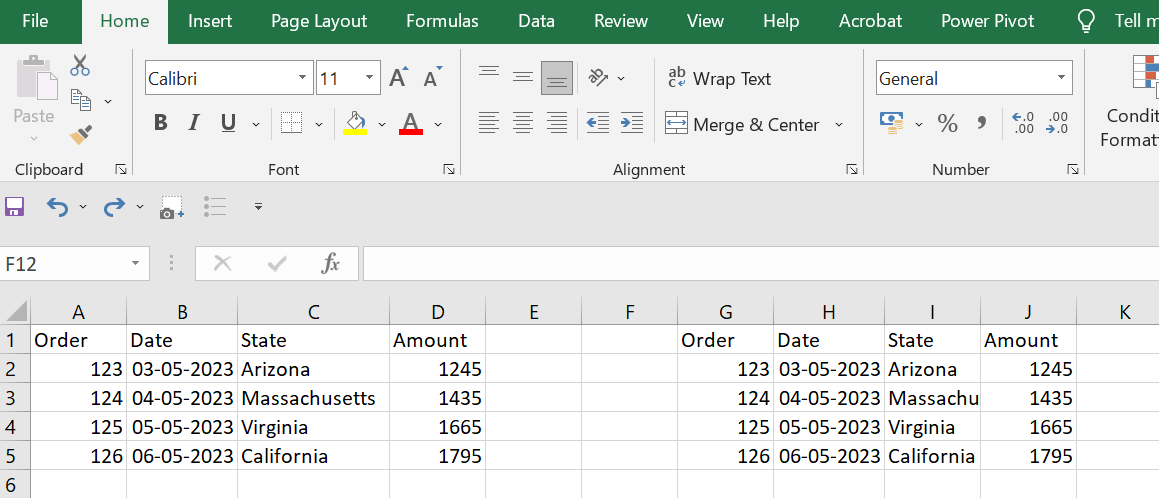
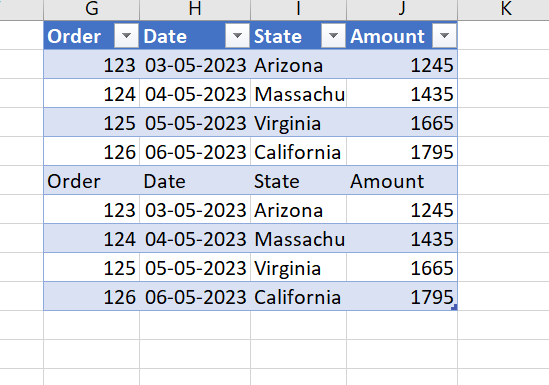
An Excel Table is a rectangular range of data that has been defined and named in a specific way. To demonstrate, I have two rectangular ranges of data. Both ranges contain the exact same data, but neither one has been defined as a table.
Next, I will convert the range on the right into a proper Table. By the way, when I say "proper table," I mean an Excel Table. This is how to do it:
- Go to the table template under the insert section on the Excel ribbon.
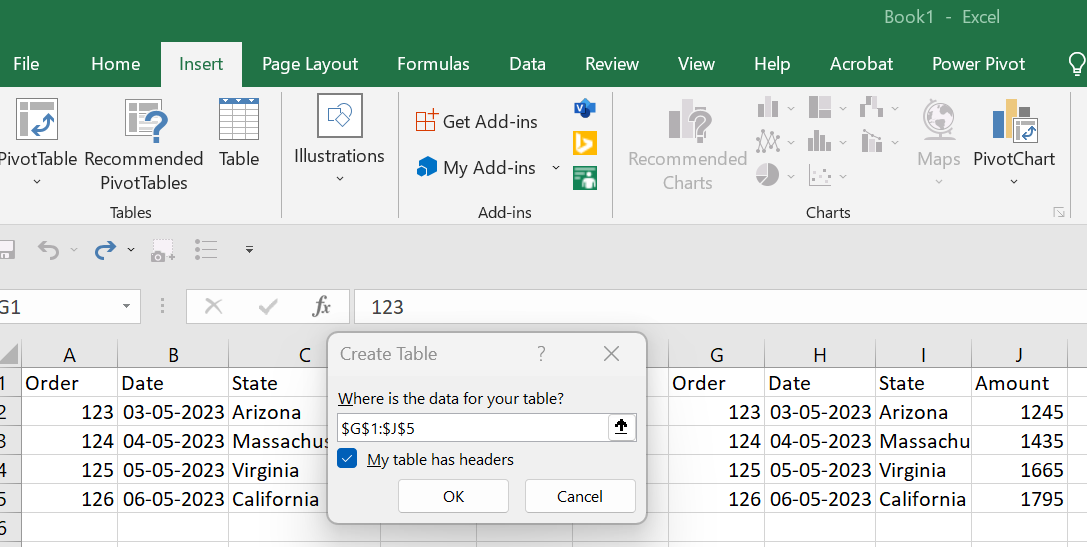
- Then click OK, the selected range becomes a table.
Or you can use the CTRL + T shortcut. In this screenshot above, you can see that the data on the left is just a range of data, while the data set on the right has been arranged into a table. So, what are the important differences between a normal range and an Excel Table?
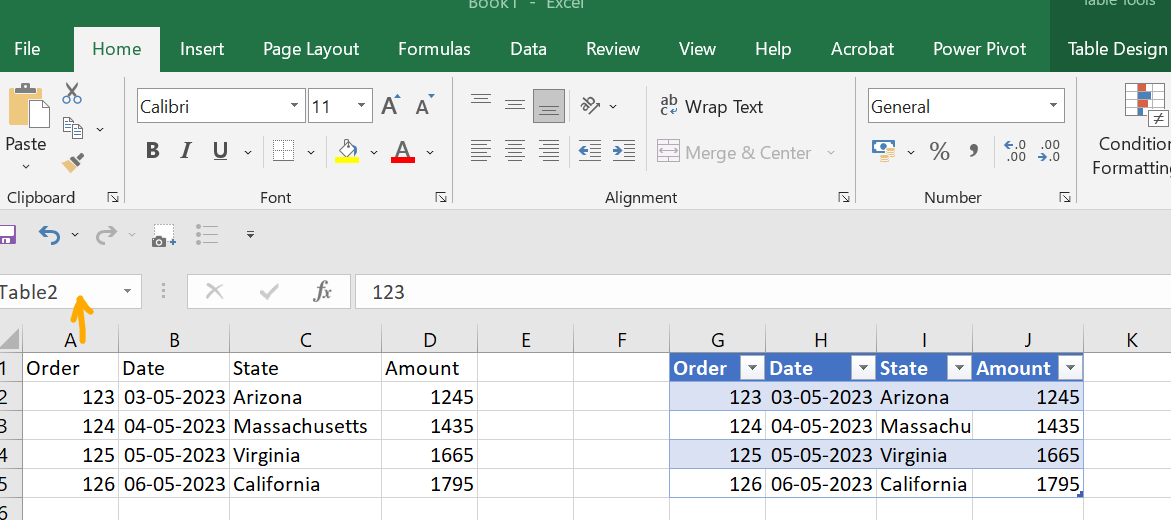
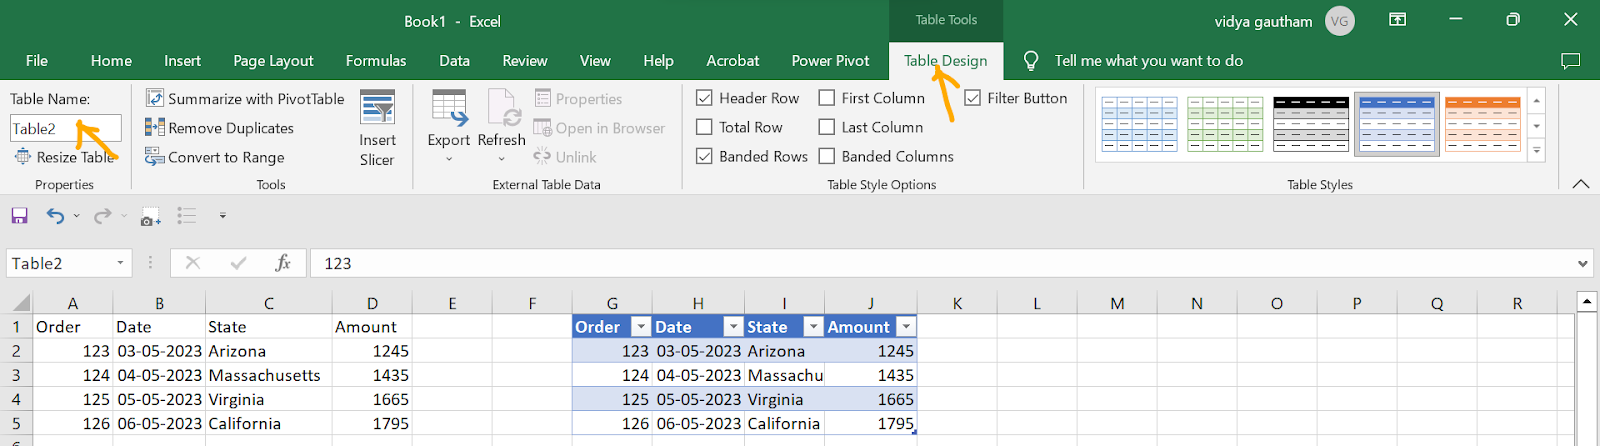
To begin with, all tables have a unique name. You can see this name in several places.
First, you will find the name in the name box menu, along with any other named ranges and tables. You can use this menu to directly navigate to the data in a table, even if the table is on a different worksheet.
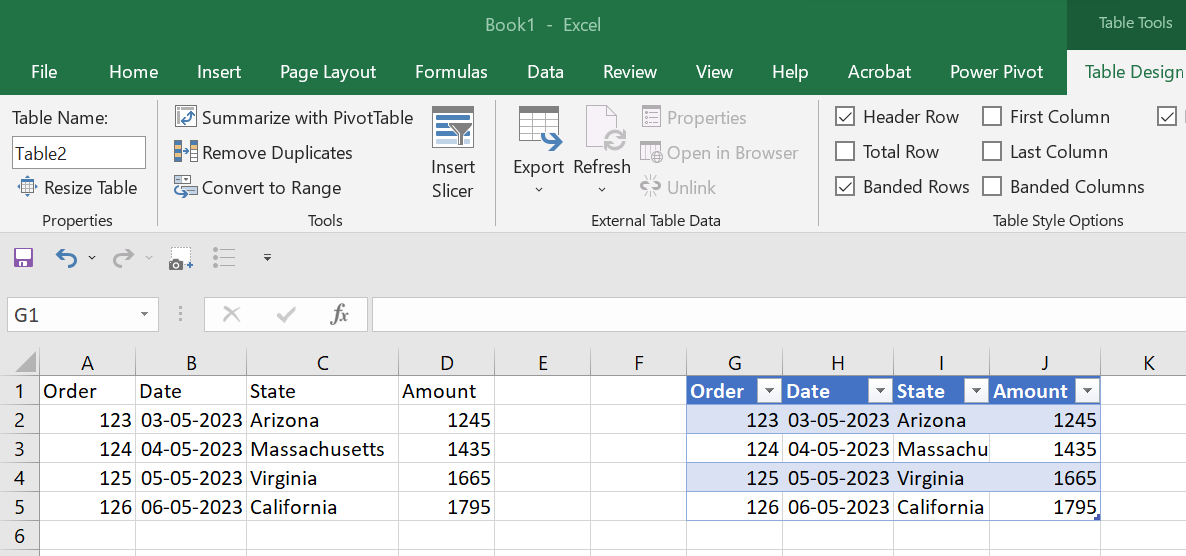
Second, you will see the table name on the Design tab under Table Tools when any part of the table is selected. Please note that this tab disappears if I move the cursor outside the table.
\
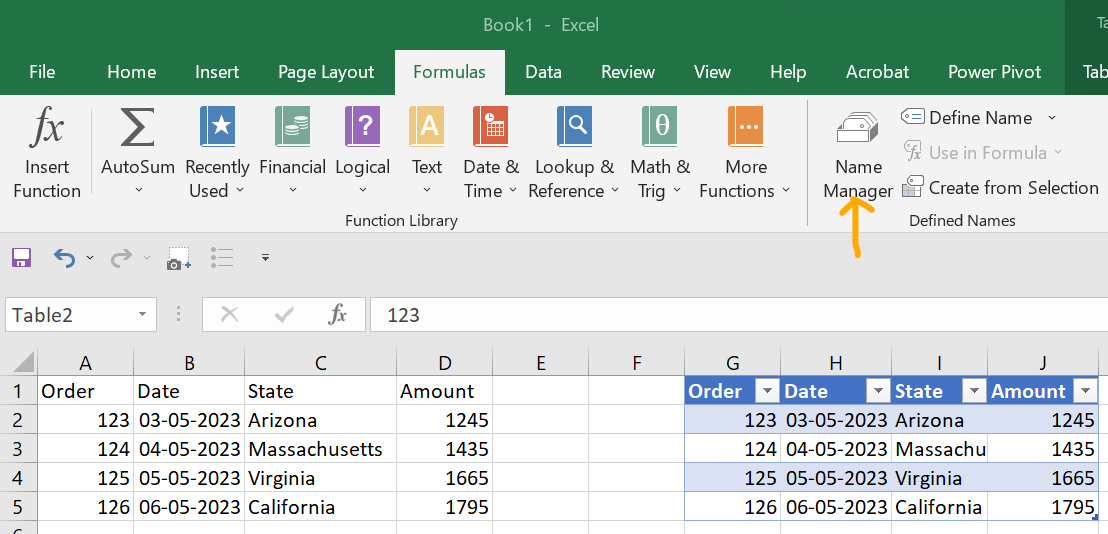
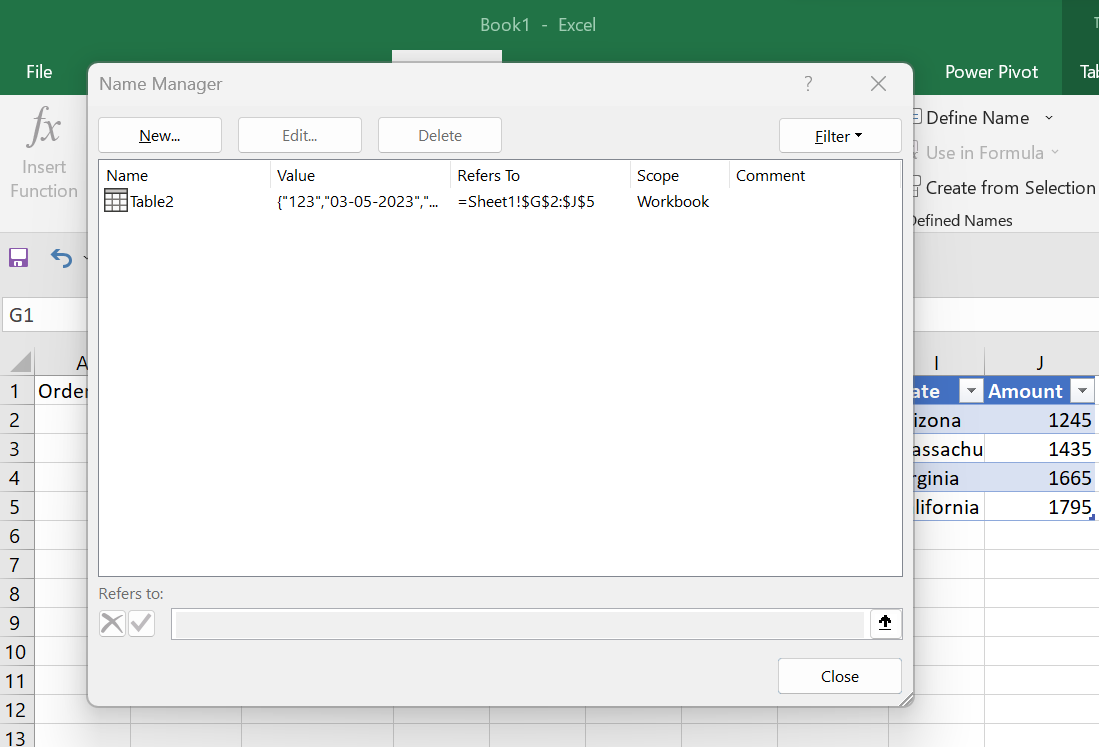
You will also find the table names listed in the Name Manager. You can open the Name Manager from the Formulas tab of the ribbon,
The pop up that comes is
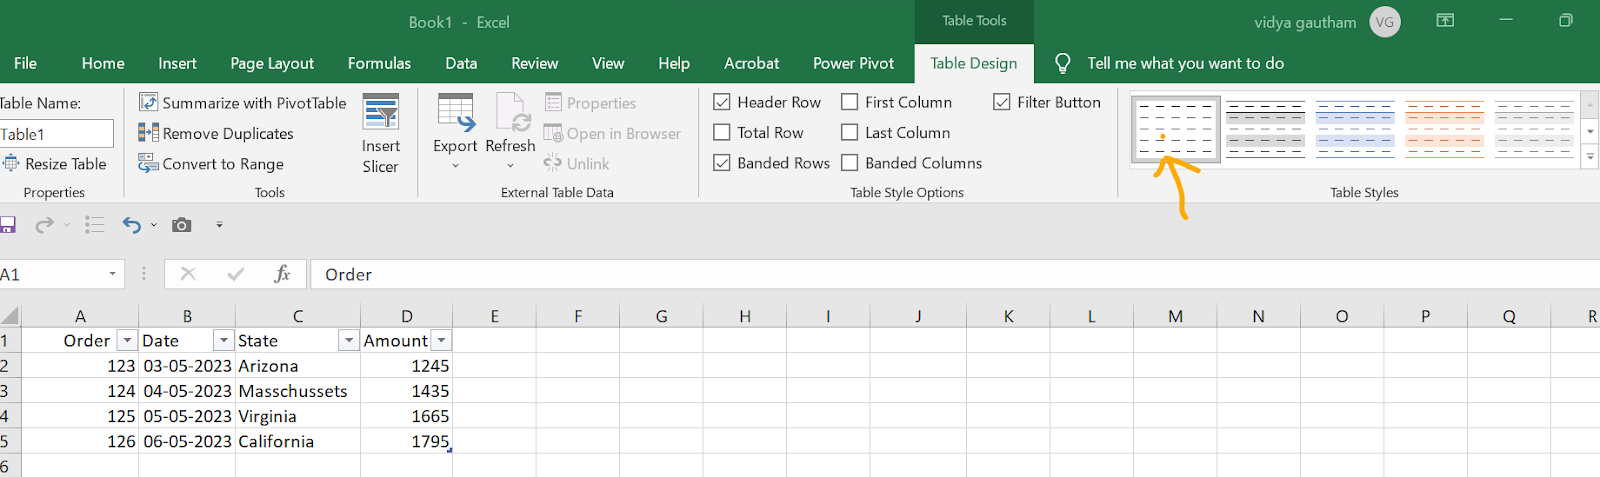
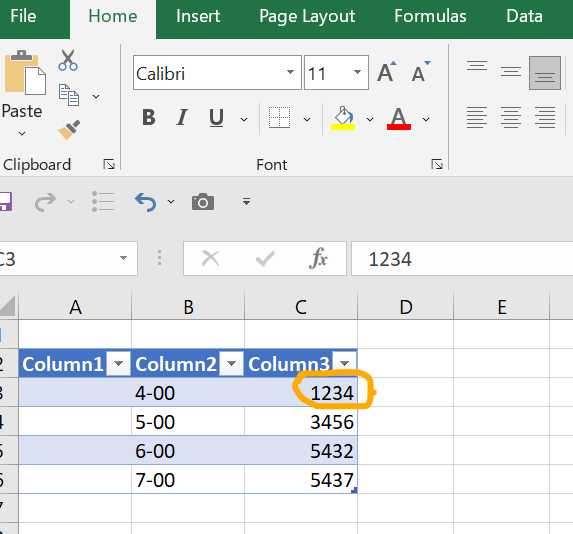
Next, notice that an Excel Table has automatic formatting. By default, we get row striping and a different header format.
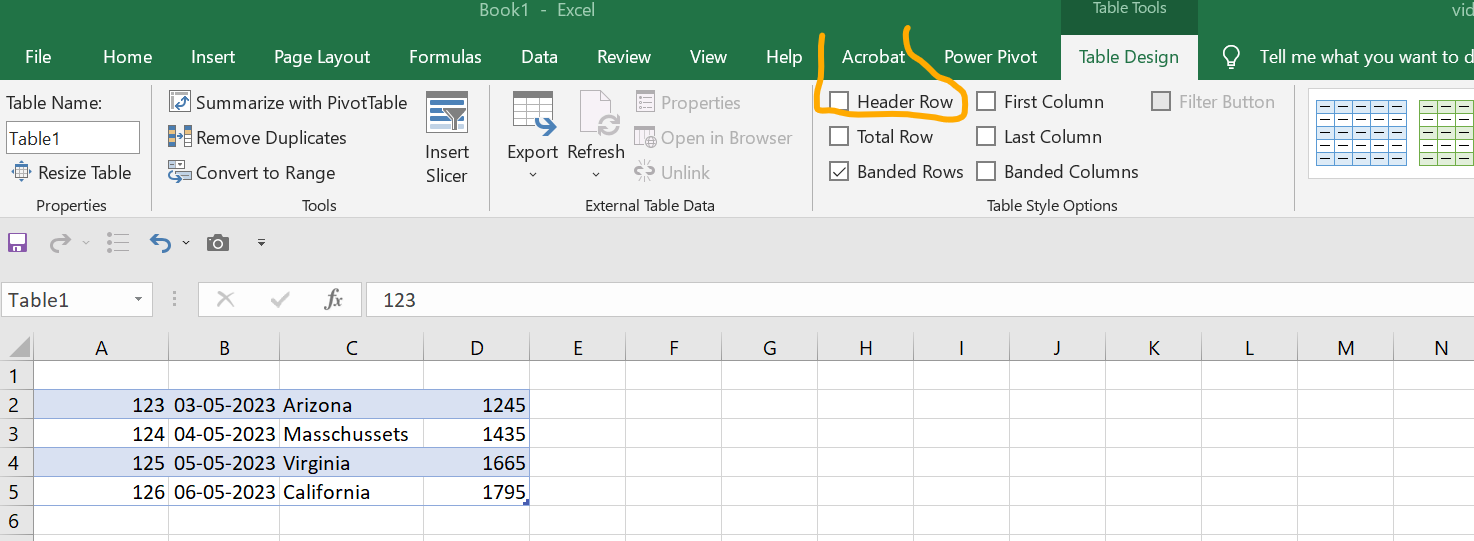
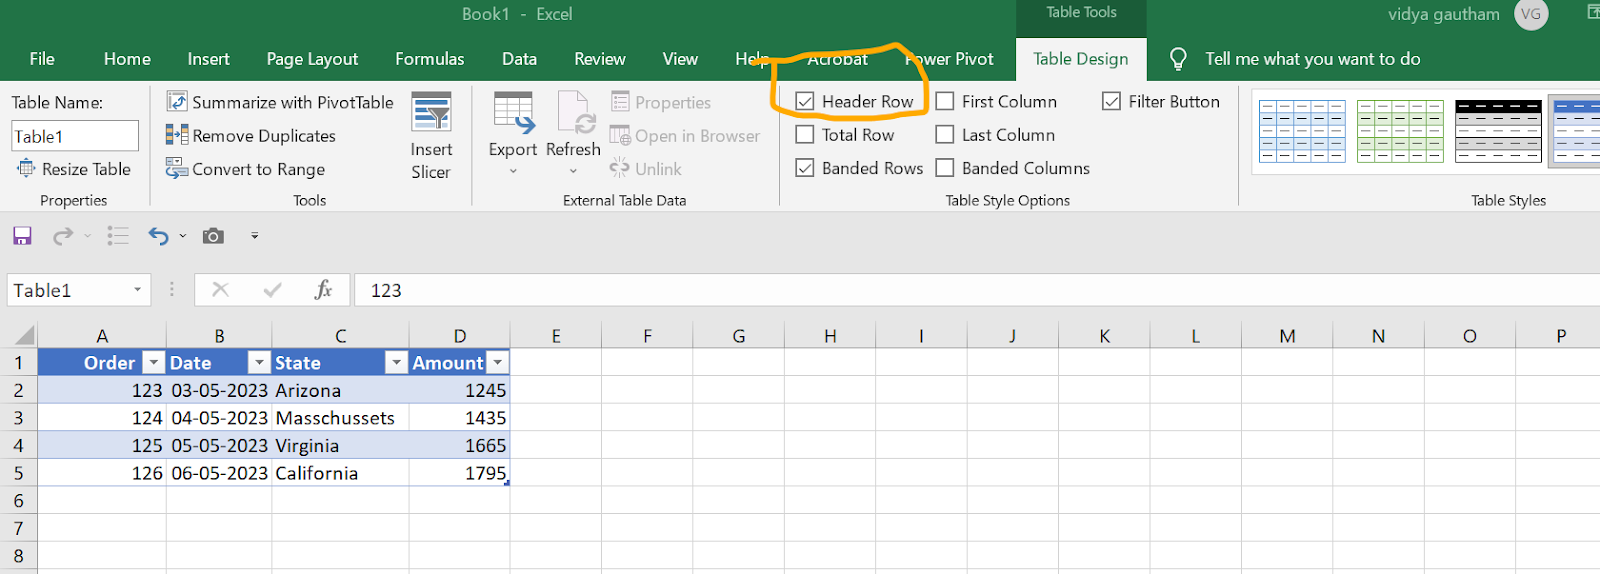
Table formatting is fully customizable, and you can even switch to "None" to maintain the current formatting.
Tables also have a filter applied by default. You can use this filter to sort and filter the data. The filter is optional, and you can easily turn it off.
Why do I need an Excel table?
Excel Tables serve as containers for your data, clearly indicating to Excel that the data in the marked columns and rows are related. This offers significant time-saving benefits. Firstly, you gain access to a range of list-related features automatically. Secondly, when you add a row, all formats and formulas are applied automatically.
Possibilities with Excel tables
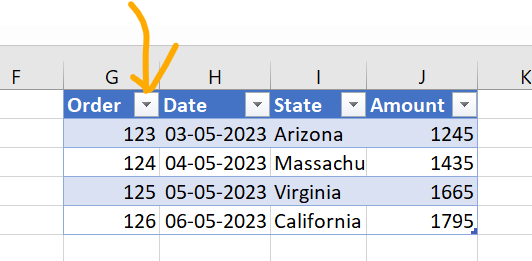
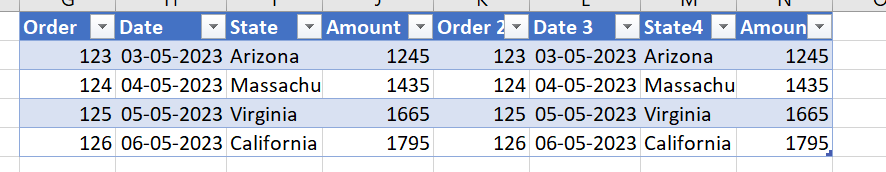
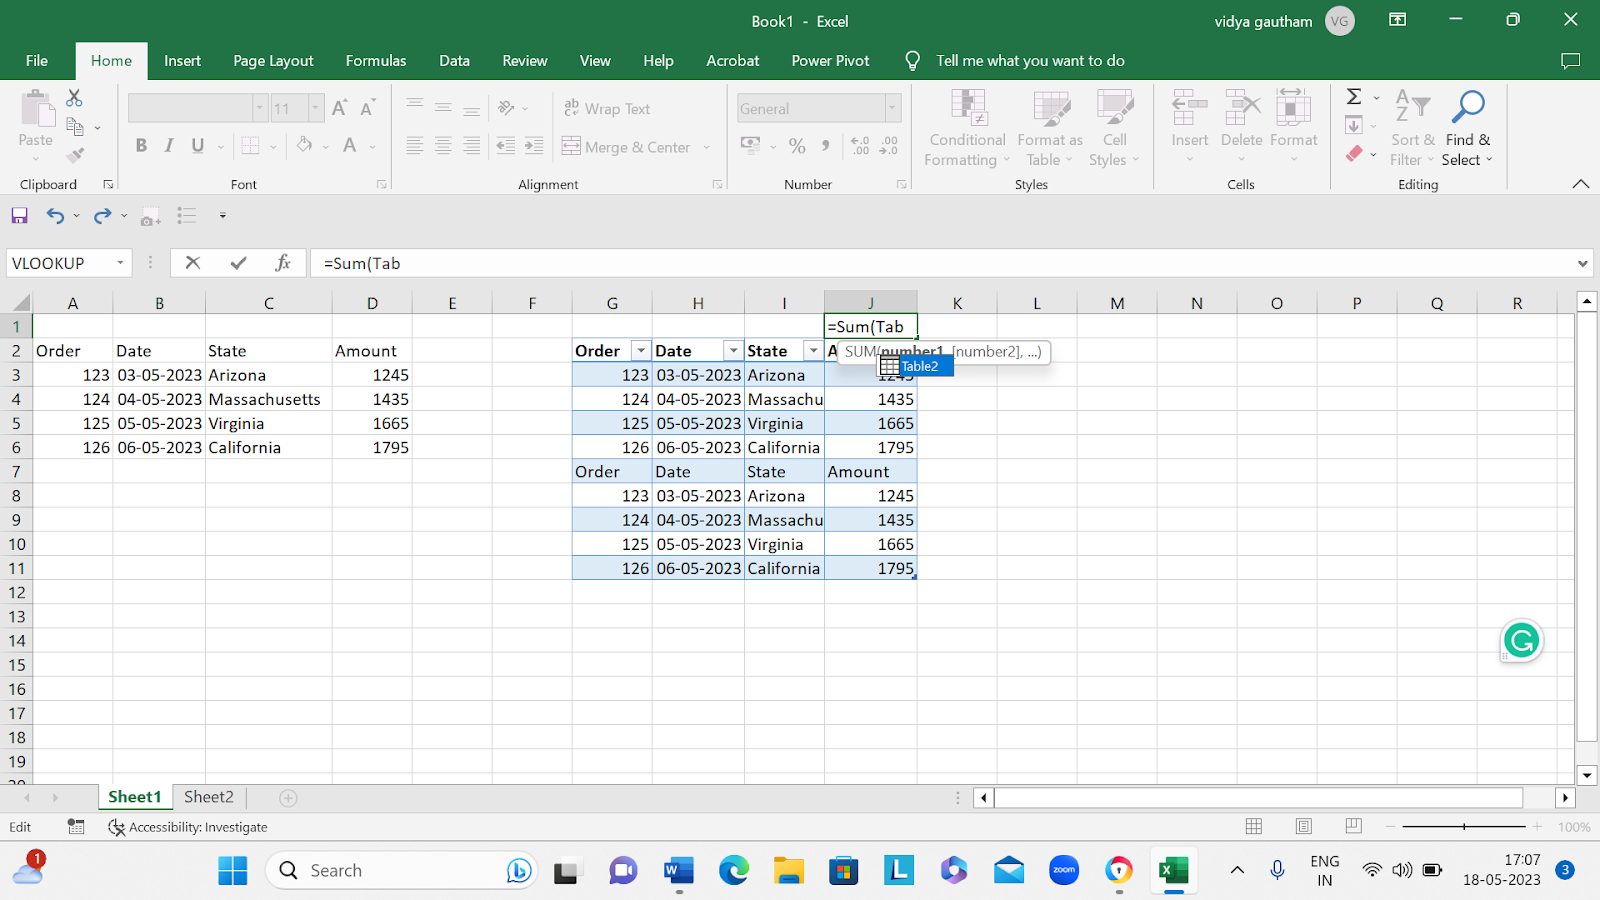
Tables automatically expand to accommodate new data. If I copy data from a second sheet, you will notice that the table expands to include it. This makes tables ideal as a data source for charts, pivot tables, and other reports where data is frequently updated.
Structured References
Second, tables provide a special formula syntax called "structured references." Structured references make it easier to write, read, and maintain formulas.
Finally, tables have convenient features for working with data in rows and columns. For example, I can use Shift + Space to select an entire row and Control + Space to select an entire column. Then, I can simply drag it to a new location in the table, and Excel won't complain about overwriting data.
SUM TABLE COLUMNS
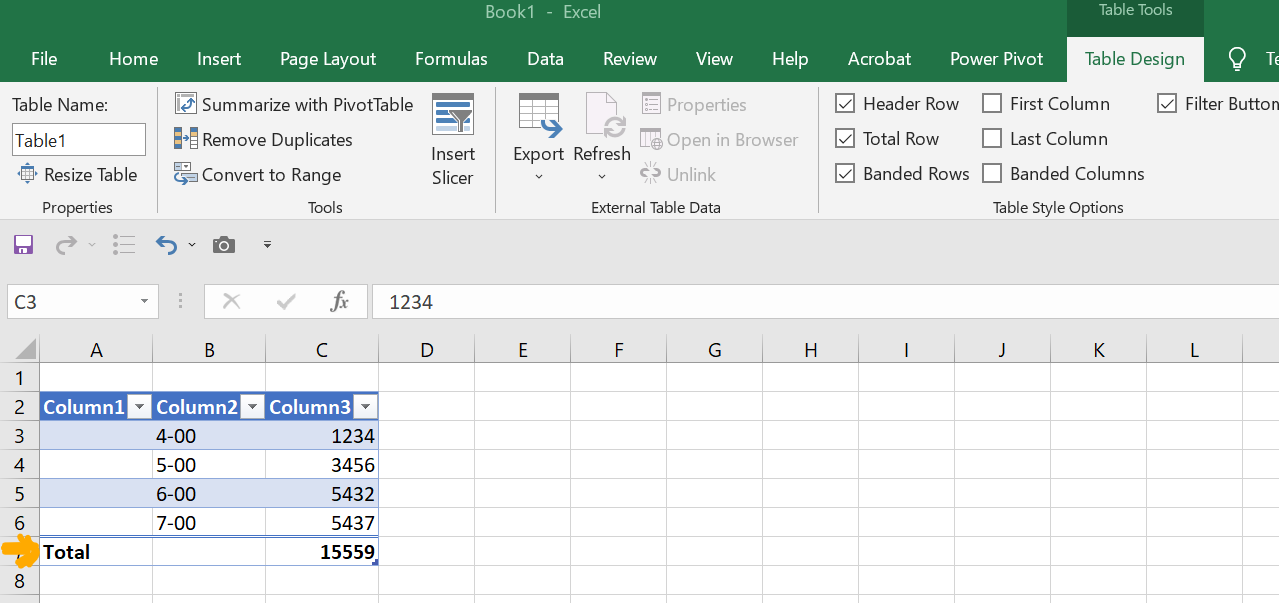
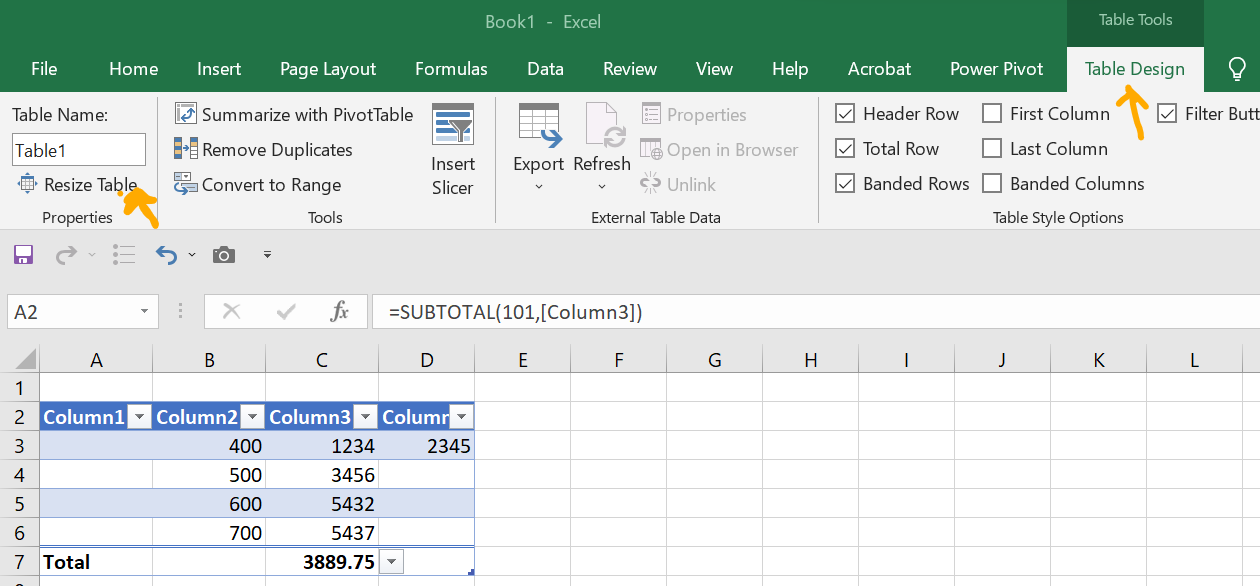
The Excel table offers a convenient feature called the Total Row, allowing you to summarize data without using formulas. To sum the data in a table, follow these steps:
- Click on a cell in the table
- Navigate to the "Table Design" tab in your application.
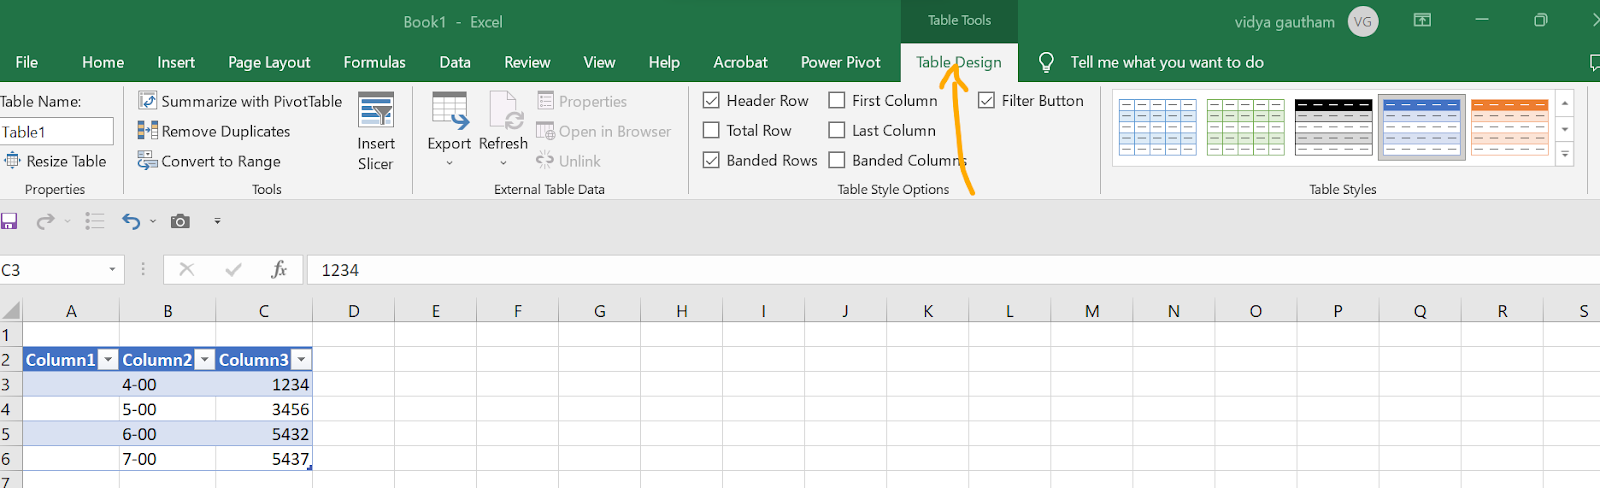
- Look for the checkbox labeled "Total Row" within the Table Style Options group. Click on it. Once you have ticked the Total Row box, the Total Row feature will be activated for your table, giving the result.
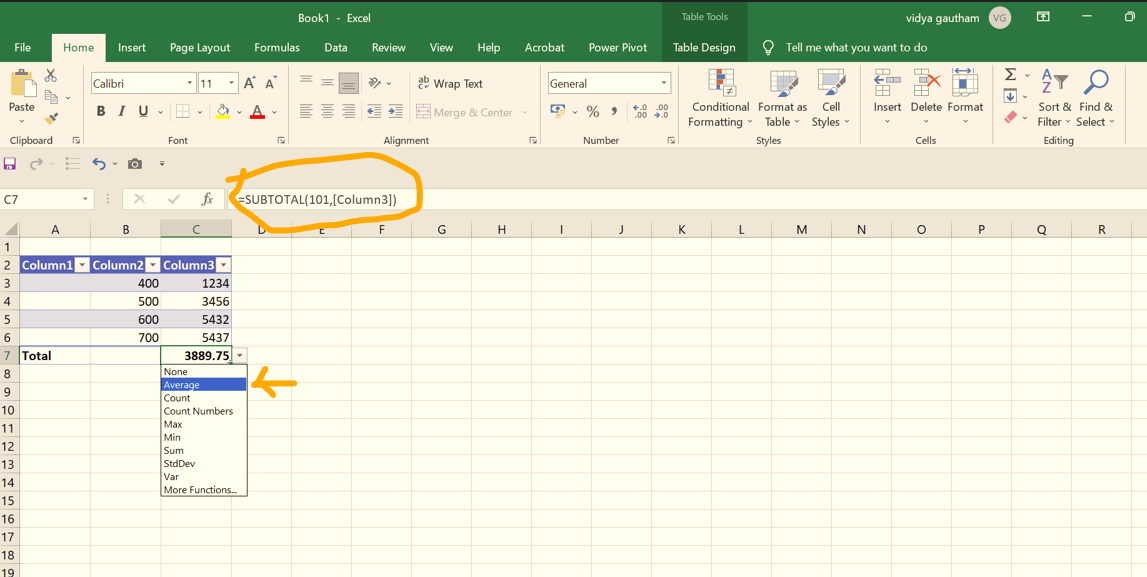
- To calculate data differently, you can click the count or average function. But in Excel, it utilizes the SUBTOTAL function, which specifically calculates data within visible rows.
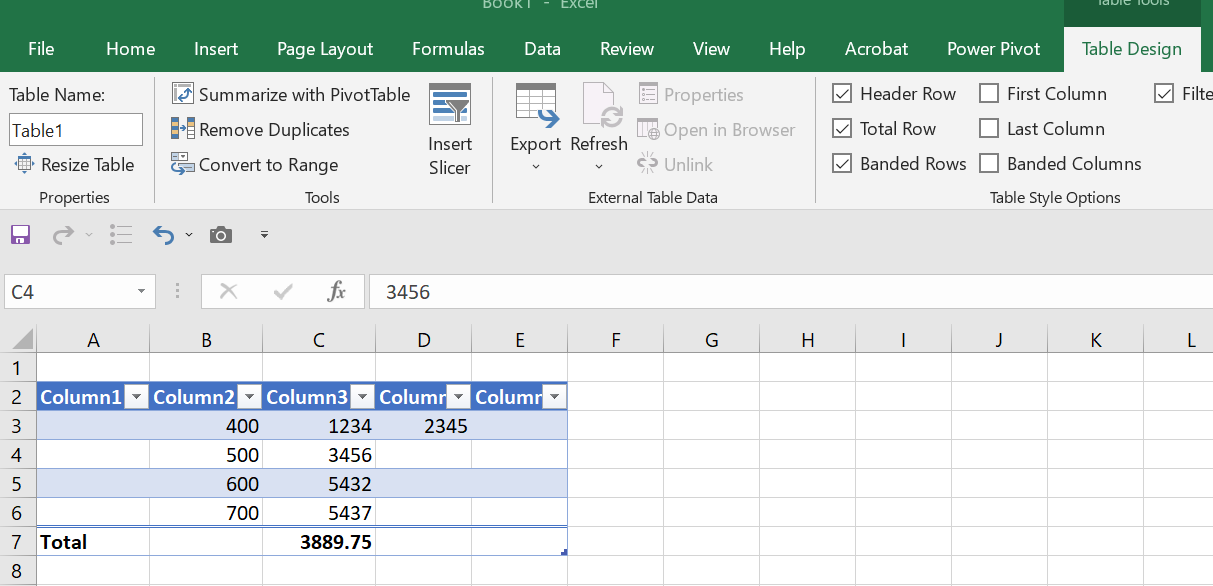
Extend a table in Excel
By entering data into an adjacent cell, Excel tables will automatically expand to accommodate the new information.
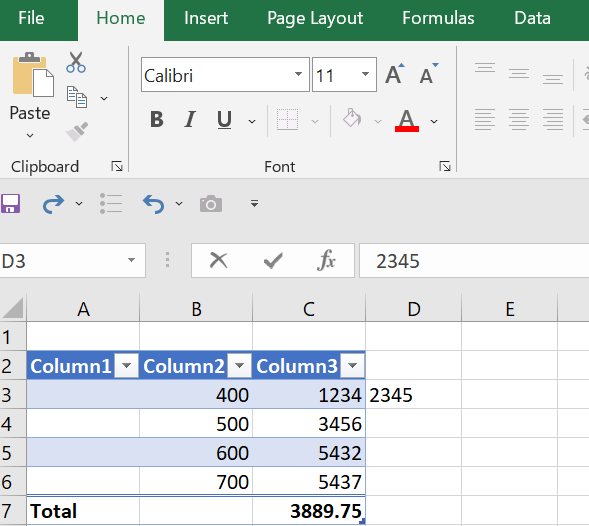
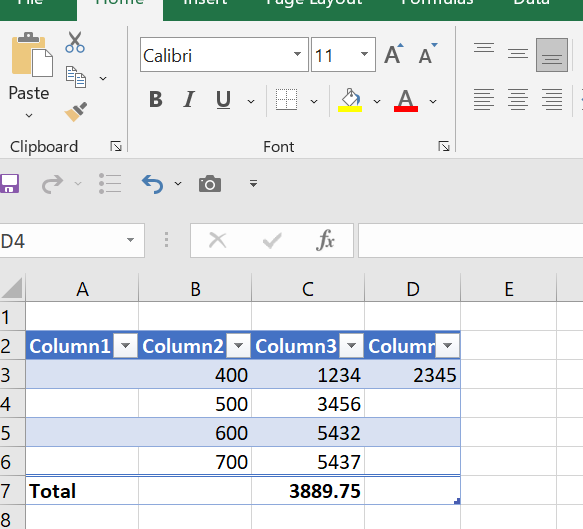
This feature, when combined with structured references, effortlessly establishes a dynamic range for your formulas, eliminating the need for manual adjustments.
To add or remove columns and rows in an Excel table, you can utilize the Resize Table command by following these steps:
- Select any cell on the table. Navigate to “Table Design” tab and select the “Resize table” section.
- In the dialog box that pops up, you can specify the number of columns and rows to add or remove from the table. And click on the OK button.
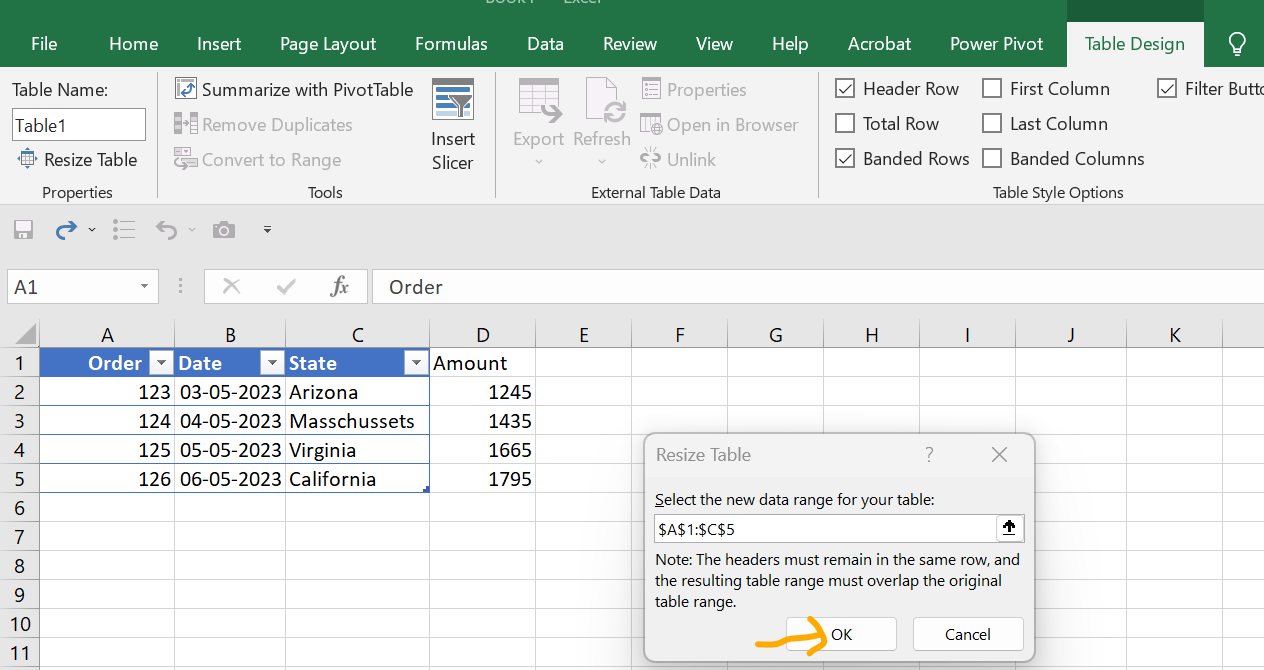
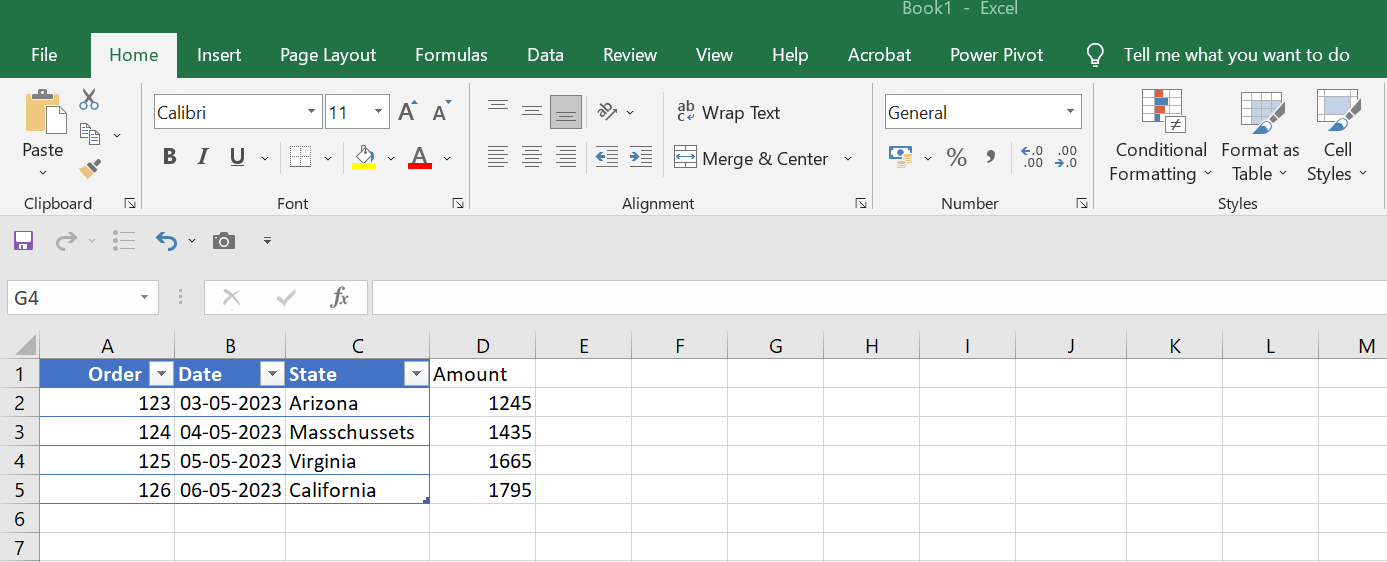
Resize the table- reduce the size screenshot below:
Resize the table- expand the table screenshot below:
Common issues with Excel sheet
When working with an Excel table, it's important to be aware of common issues that may arise:
- Ensure your Excel table includes the entire list: Check for empty or nearly empty columns or rows. To adjust the table range, go to the bottom right corner of the table and drag the outlines to include the desired columns and rows.
- Expanding or adding a row to the Excel table: Simply fill in the column next to the table or add a row below it, and it will automatically be incorporated into the table.
- Reverting an Excel table to a normal list range: If you no longer need the Excel table, select the table, go to Table Design, and click on "Convert to Range" on the left-hand side. The chosen layout will be preserved.
Conclusion
Excel provides powerful features that allow you to work efficiently with your table data. By utilizing structured references instead of traditional cell references, you can create more dynamic and readable formulas. Additionally, Excel's data validation feature ensures data integrity by allowing you to define specific rules and restrictions for your table columns. With these tools at your disposal, you can streamline your data analysis process and maximize the accuracy and reliability of your Excel tables. To know more about the simulation based Excel course at keySkillset. check out the Excel Efficiency course page of the website.
.jpg)
.jpg)

.jpg)
.jpg)


.png)

