
Visual learners use graphics to understand the world. It’s easier to look at PowerPoint charts or graphs and draw conclusions than going through an oversized spreadsheet. Therefore, PowerPoint charts act as an alternative to messy lists of data.
With presentations, don’t forget about visual learners. If our audience is full of visual learners, you need PowerPoint graphs to drive the key points of a presentation. Moreover, a few well-placed PPT charts and graphics will ensure your audience understands your important points.
The screencast below is a step-by-step guide to building your first chart in PowerPoint. I’ll walk you through how to make a chart in PowerPoint.
Here are the key learning outcomes:
- Insert your first chart on a PowerPoint slide.
- Add and modify data using Excel inside of PowerPoint.
- Tweak the look and feel of your chart to help it stand out.
How to work with PowerPoint chart styles?
With your chart selected, find the Design button on the PowerPoint ribbon, just under the Chart Tools tab. No matter which type of chart you’re working with. Besides, there are many pre-set styles to change the look of your PowerPoint chart.
Click on one of these styles to apply it to your chart. Many of these will add some shadow or depth to the chart. It can really help your chart stand out. Try out some of these styles for different ways to view the same data.
How to change chart colors in PowerPoint?
Besides styles that add depth or contours to your charts, you can also change the color scheme. A couple of clicks within PowerPoint chart tools and your slides will become more alive.
What is a chart versus graph in PowerPoint?
The terms charts and graphs are used interchangeably. But in fact—they serve different purposes.
Charts in PowerPoint don’t have to include numeric values. They can be solely based around showing information in a structured format. For example, the periodic table of elements. A chart is a general term for many types of data, organized in a structured format.
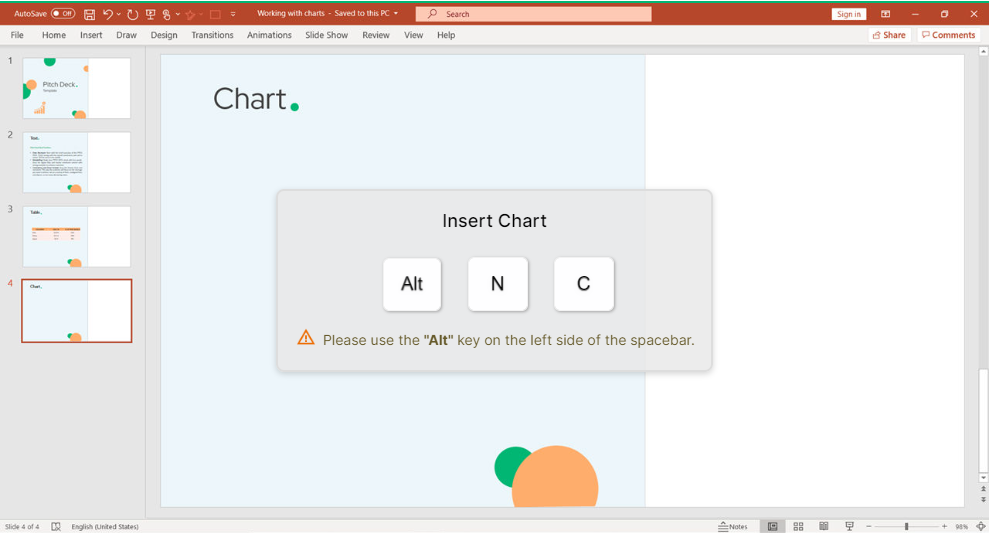
How to insert a chart in PowerPoint?
Start creating your presentation by inserting a chart with an easy keyboard shortcut Alt N C.
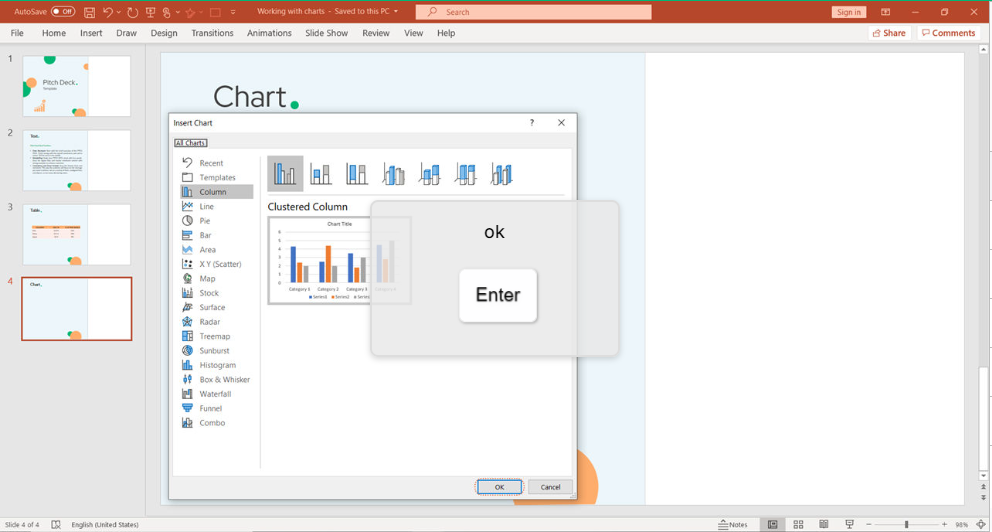
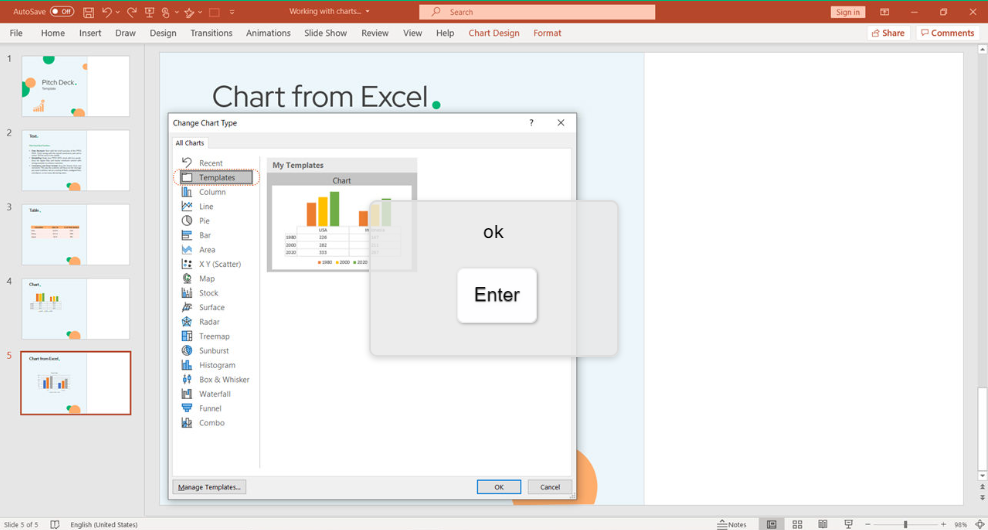
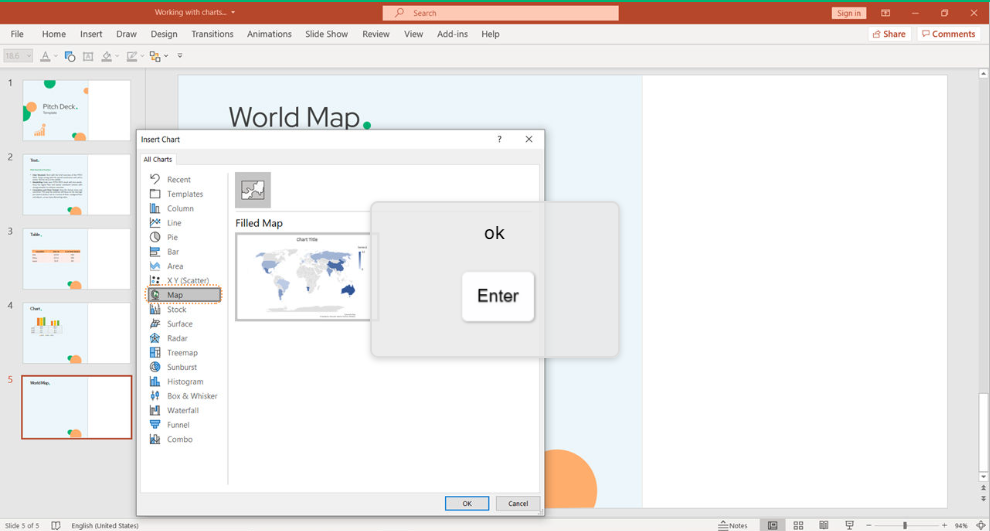
When the window pops up, choose the chart you like and click Enter.
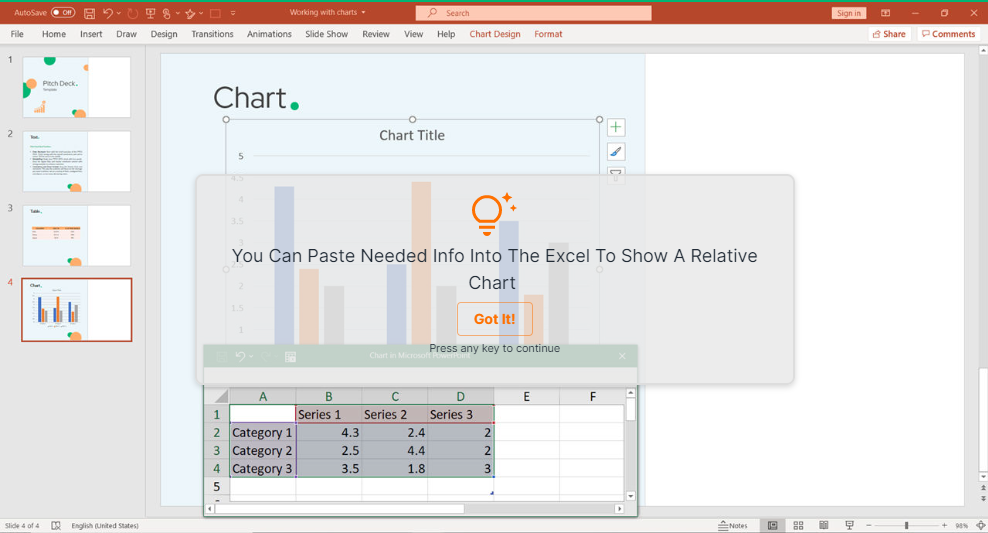
Once the graph appears, you will have an Excel spreadsheet to work with. It allows to Copy-Paste any data related to your company.
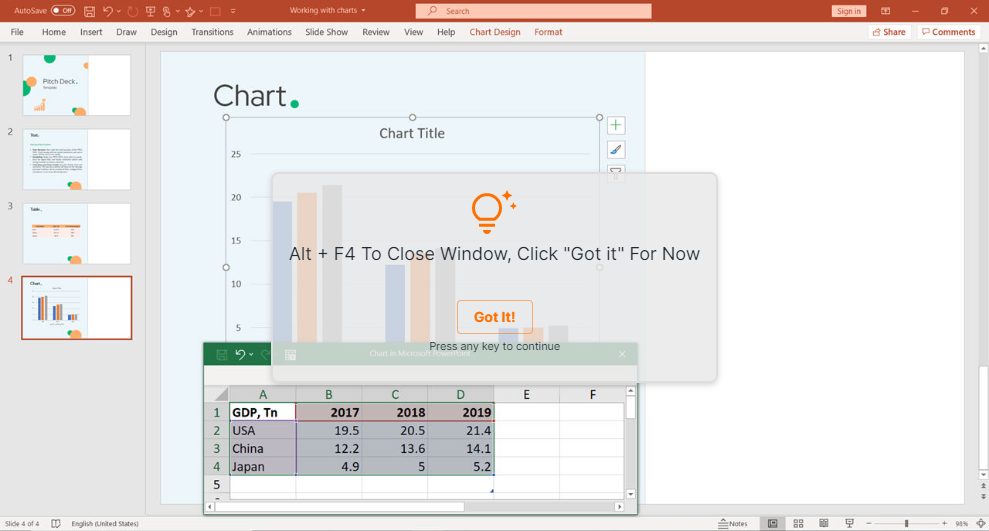
However, if you want to work with the chart design first, you can close the window with Alt + F4.
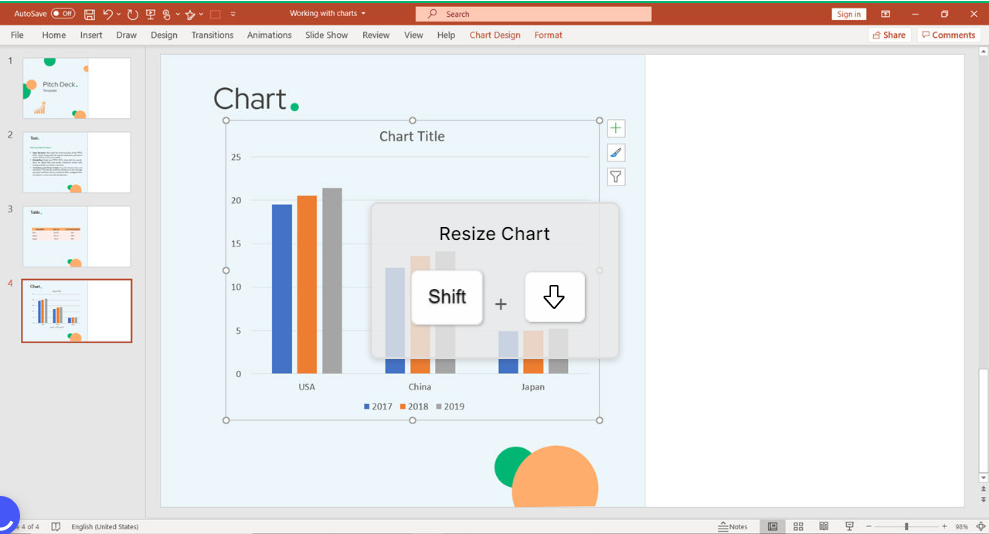
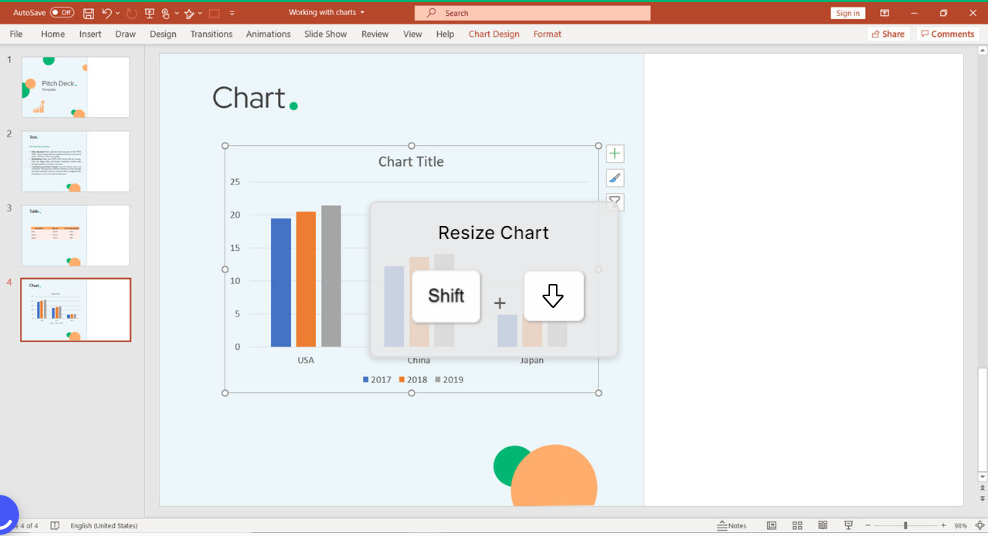
Resize your chart to fit the slide by clicking on Shift + Arrow Down/Left.
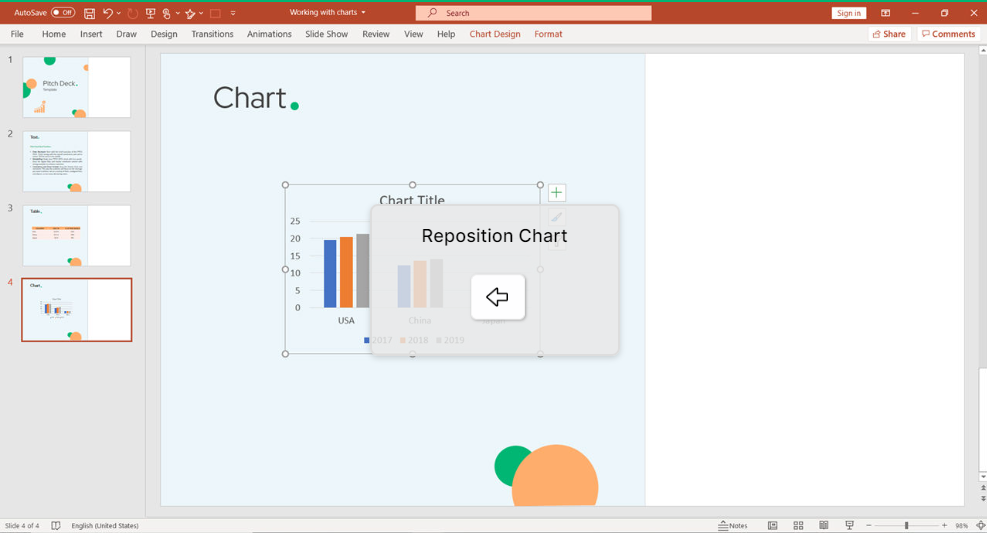
Change the position of your chart with the Arrows on your keyboard.
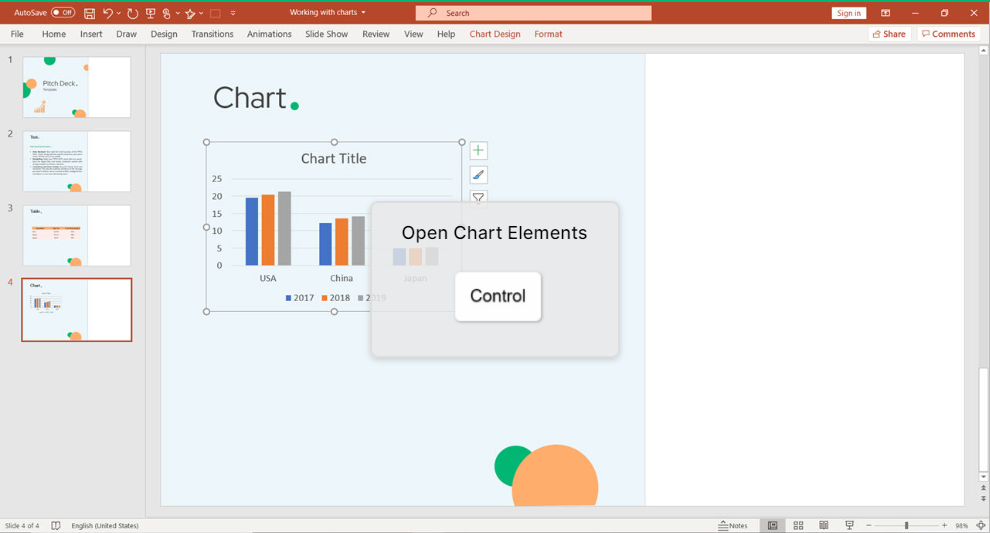
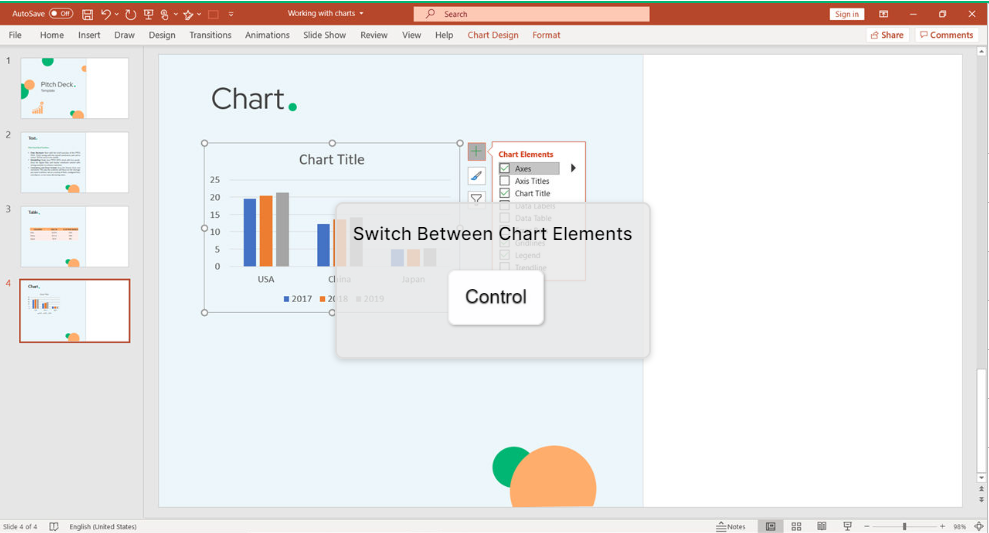
Here is the most exciting part: working with the chart elements. You can access different options by clicking on Ctrl.
Same shortcut (Ctrl) allows to switch between elements.
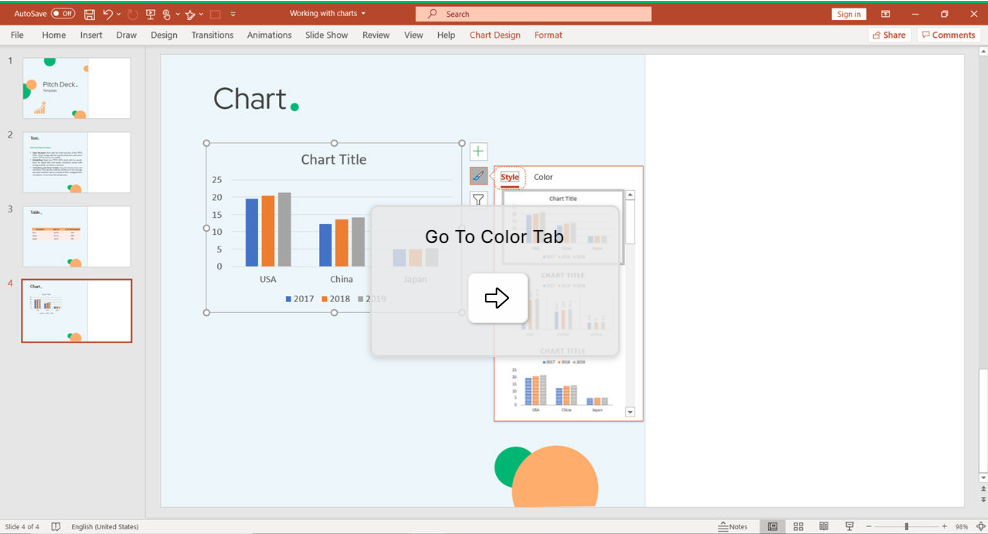
To move to the color tab use the Arrows. Once you chose, click Enter.
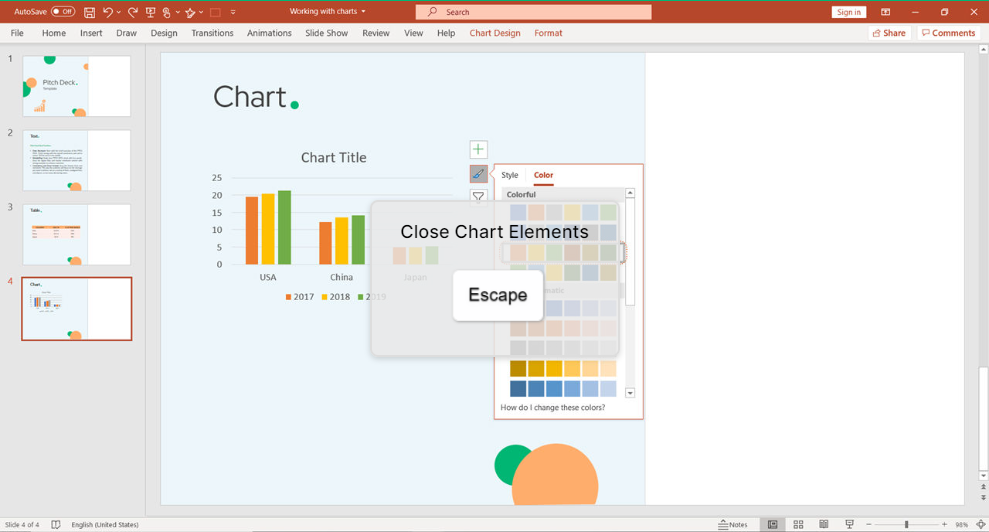
To close the chart elements window, press Esc.
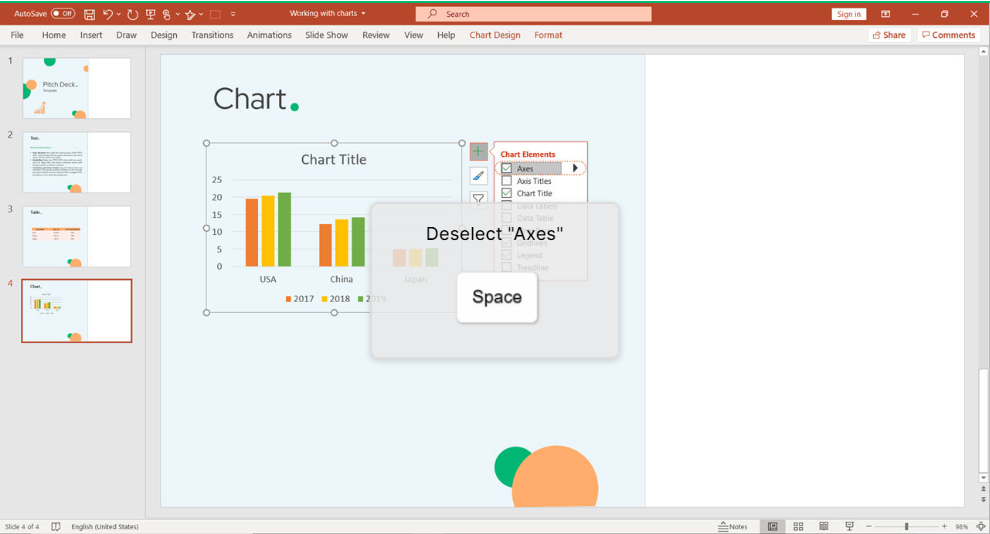
If you want to deselect the Axes, press Space-Bar.
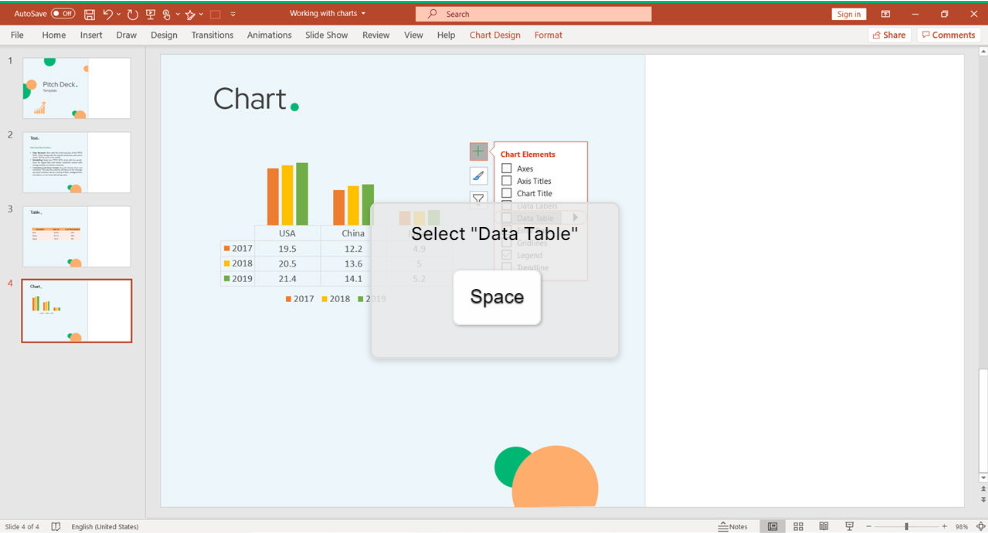
Use the same shortcut (Space-Bar) to select Data Table.
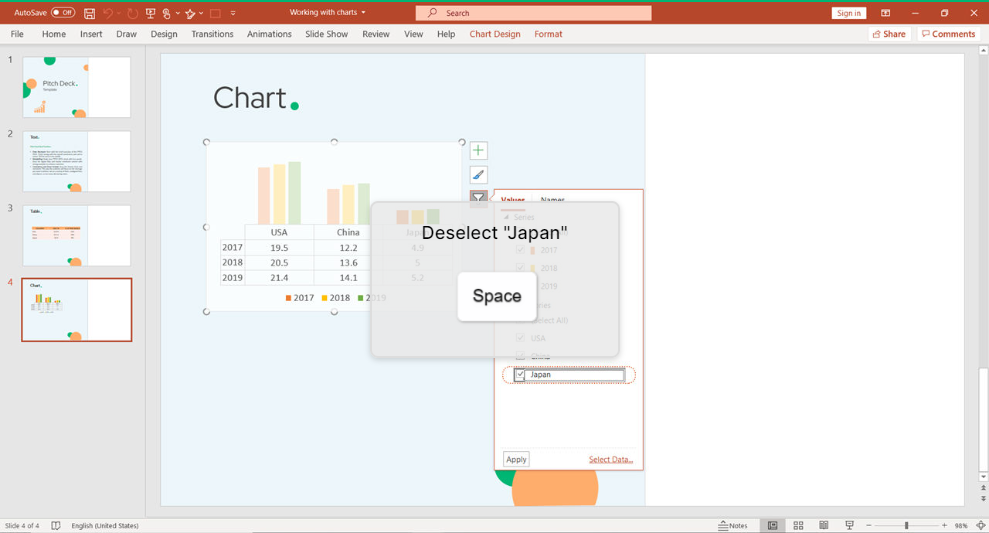
Again, click on Space-Bar to deselect ‘Japan’.
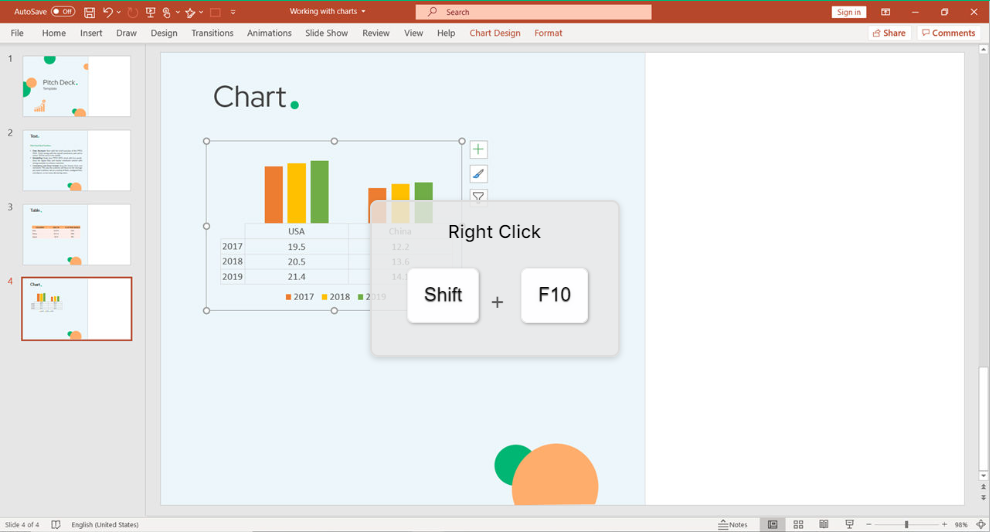
Select your chart and Right Click (Shift + F10).
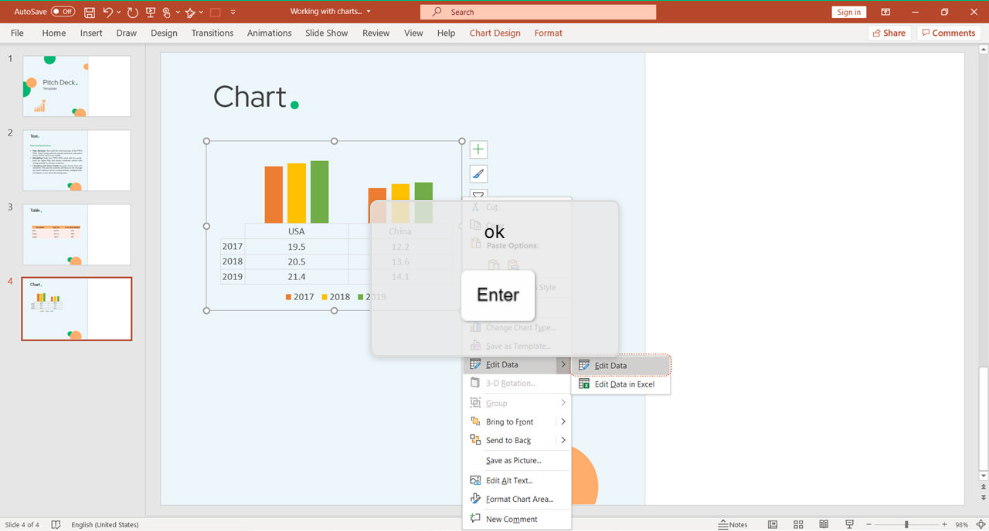
Start editing your data by pressing on E followed by Enter.

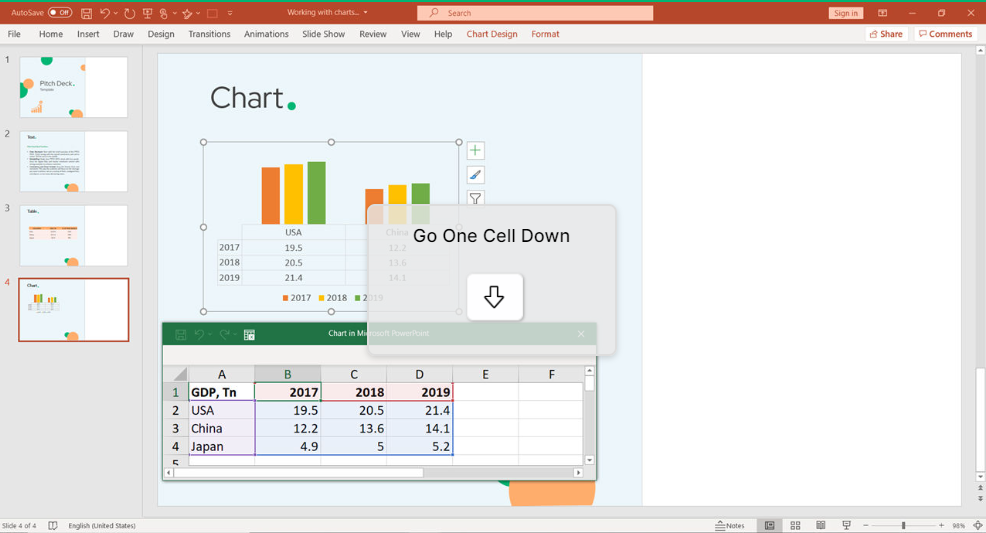
The Excel spreadsheet will open and you can navigate into it by clicking on the Arrows on your keyboard.
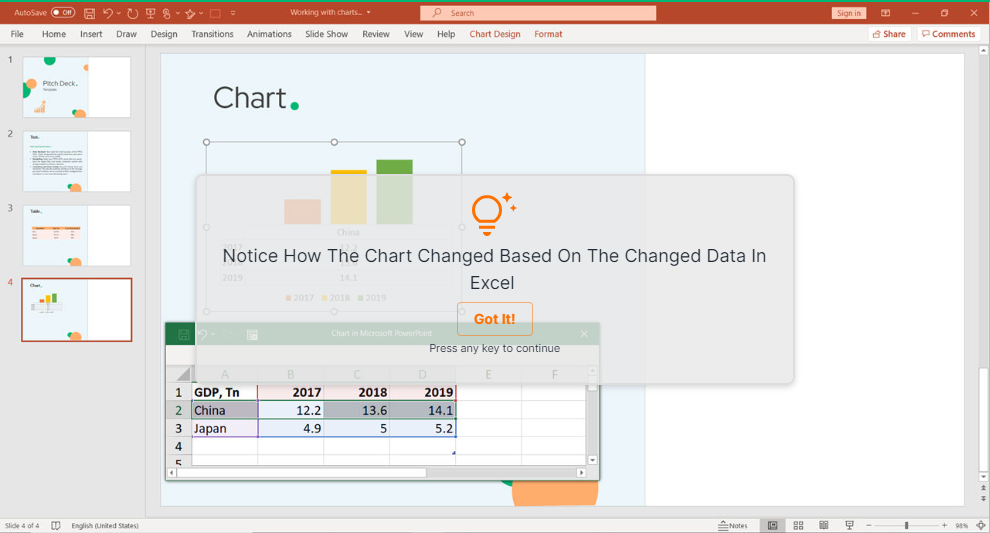
The chart changed on the changed Data.
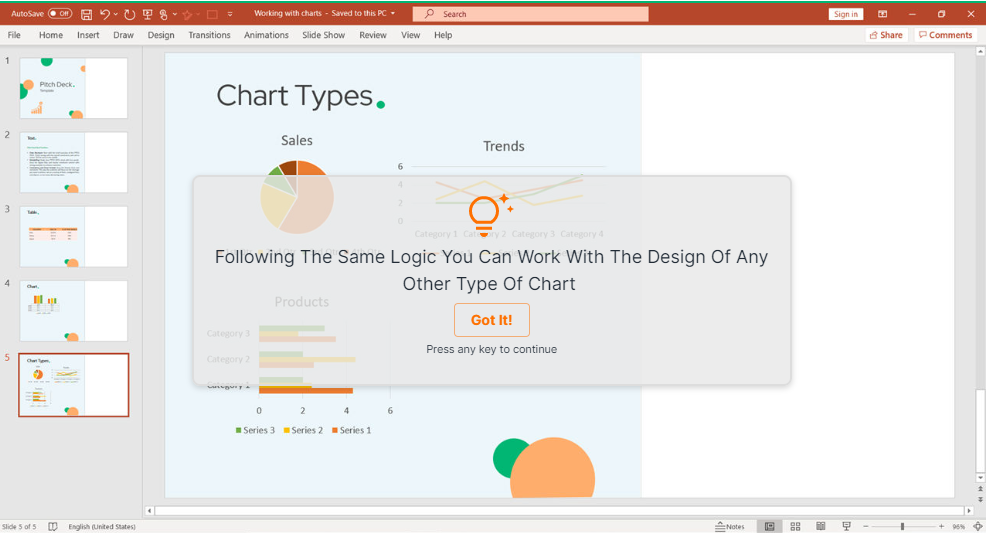
You can unleash your creativity with any type of chart.

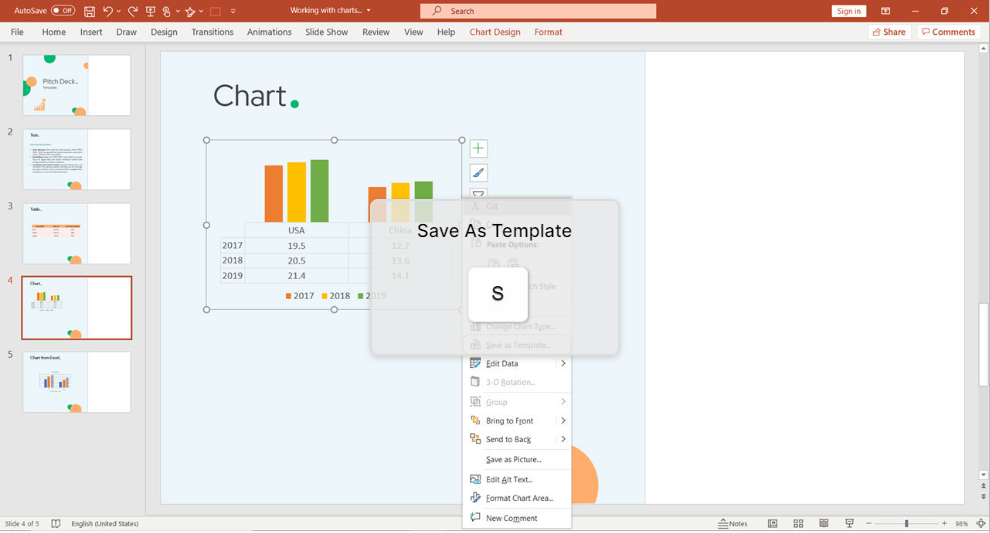
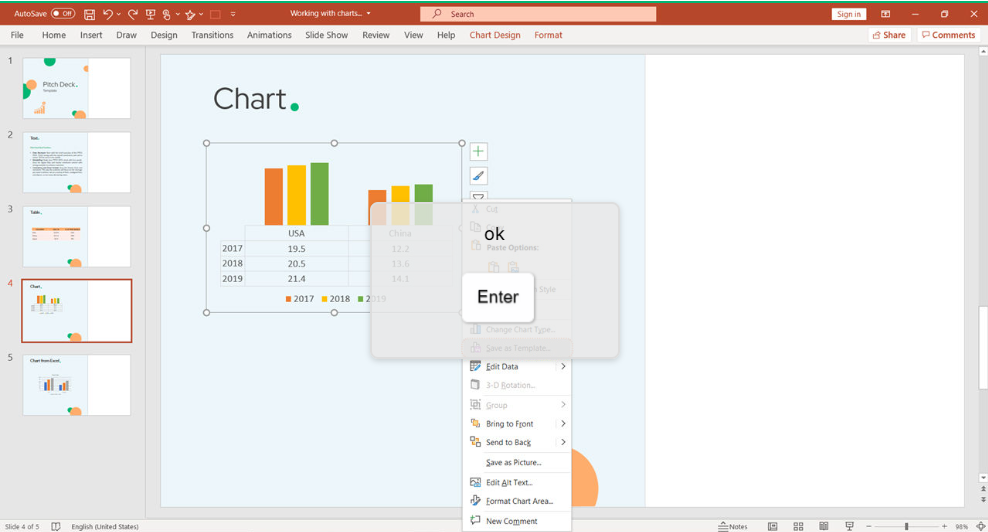
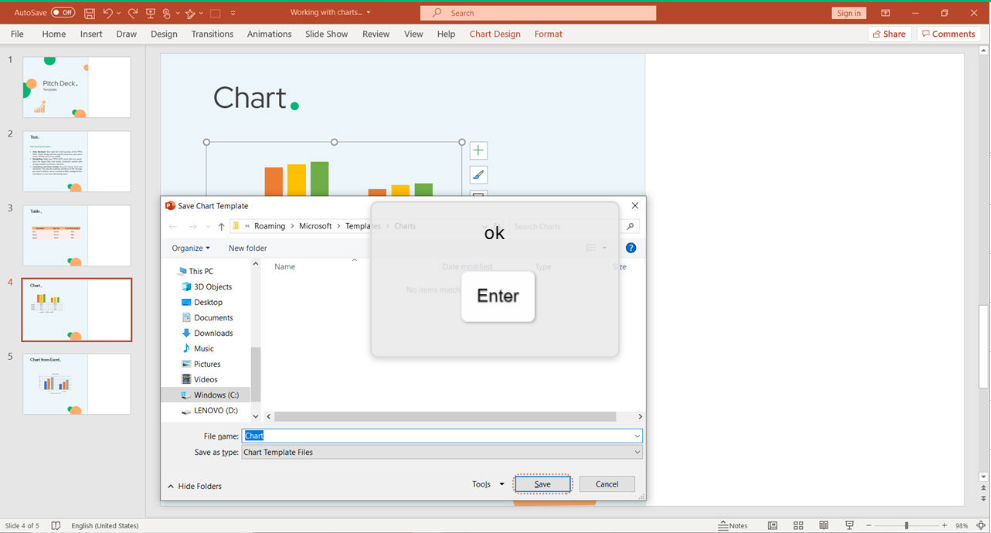
Here is another trick to allow you to save the chart as a template. When you select the chart, use Shift + F10 and select S. Press Enter and again Enter to save it.
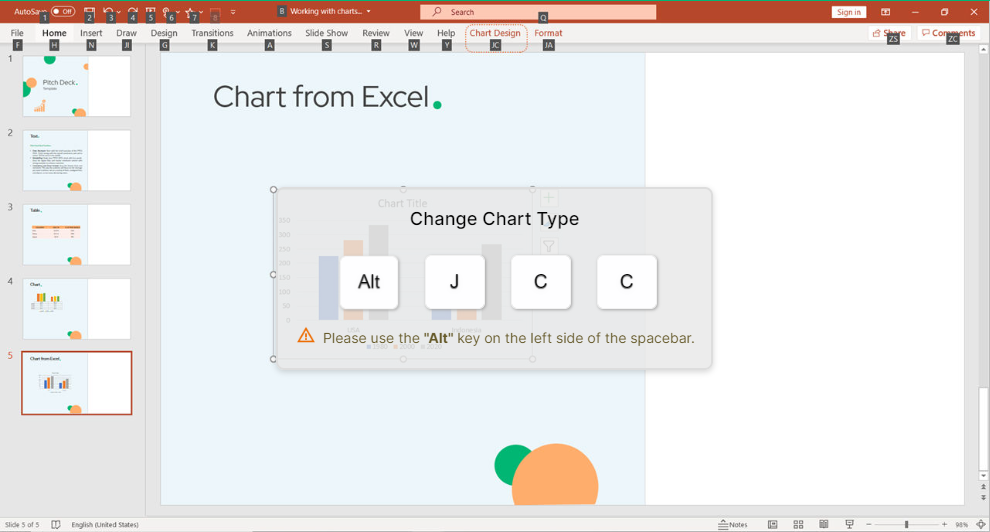
In PowerPoint, if you don’t like the chart type, just change it. Use Alt J C C, select the chart type you like and Enter.

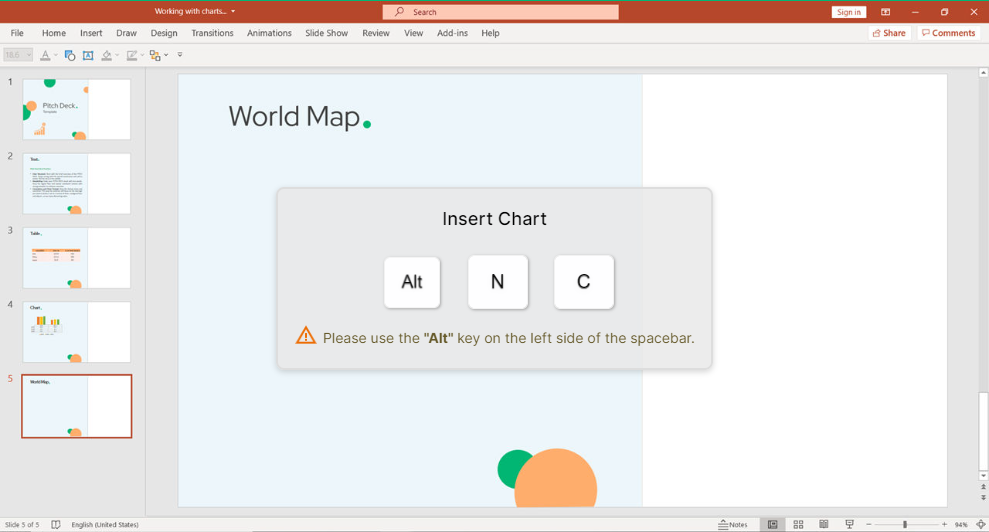
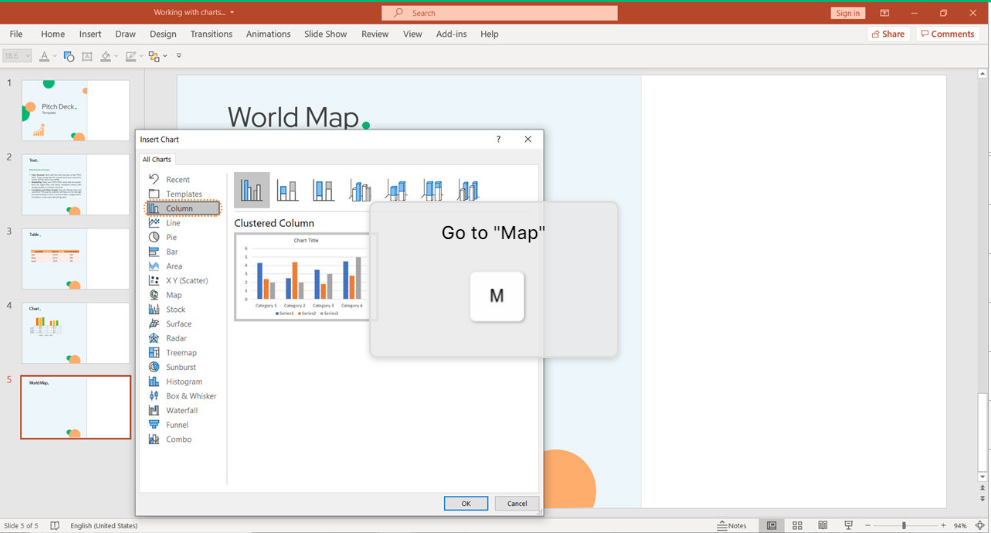
One of our favorite shortcuts allow us to insert a World Map. Press Alt N C.
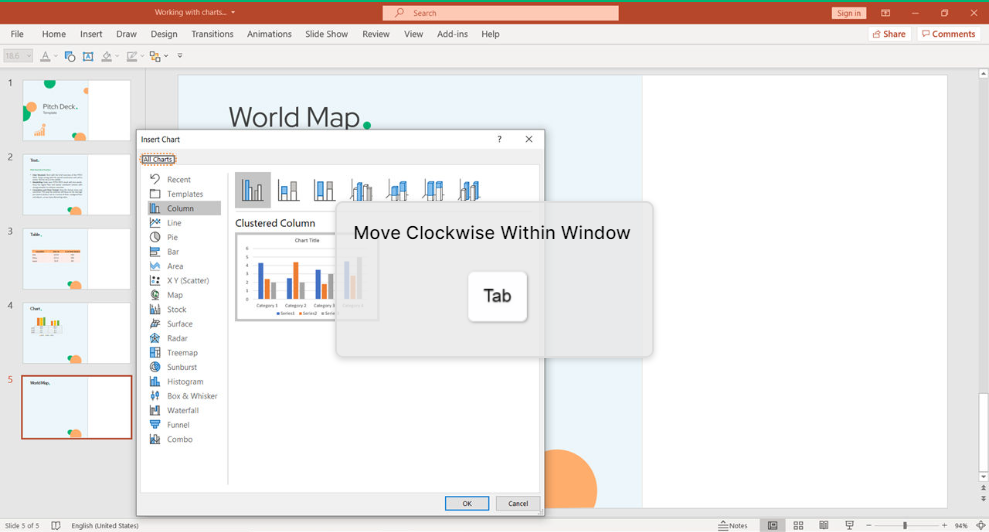
Use Tab to move clockwise within the window.
Click on M to select the Map section and press Enter.
Conclusion
Keyboard shortcuts are the easiest way to do things faster. However, with a wide variety of software, it’s hard to remember all the different shortcuts. Even though we all know they are useful, few of us bother using them. keySkillset is happy to provide the best solution on the market to build muscle memory and master PowerPoint charts.
.svg)

.svg)
Start learning new skills with the help of KeySkillset courses and our learning management system today!


keySkillset is a Learning Management System developed to make learning key business software skill sets easy through guided simulated learning.


